DSP-Based Implementation of a Real-time Sound Field Visualization System Using SONAH Algorithm
Following are some dynamic sound field visualizing test results of the prototype system:
(GIFs loading may need a little time)
FPS: 62.5
- Sound field visualization of 2000Hz sine wave on the left speaker:
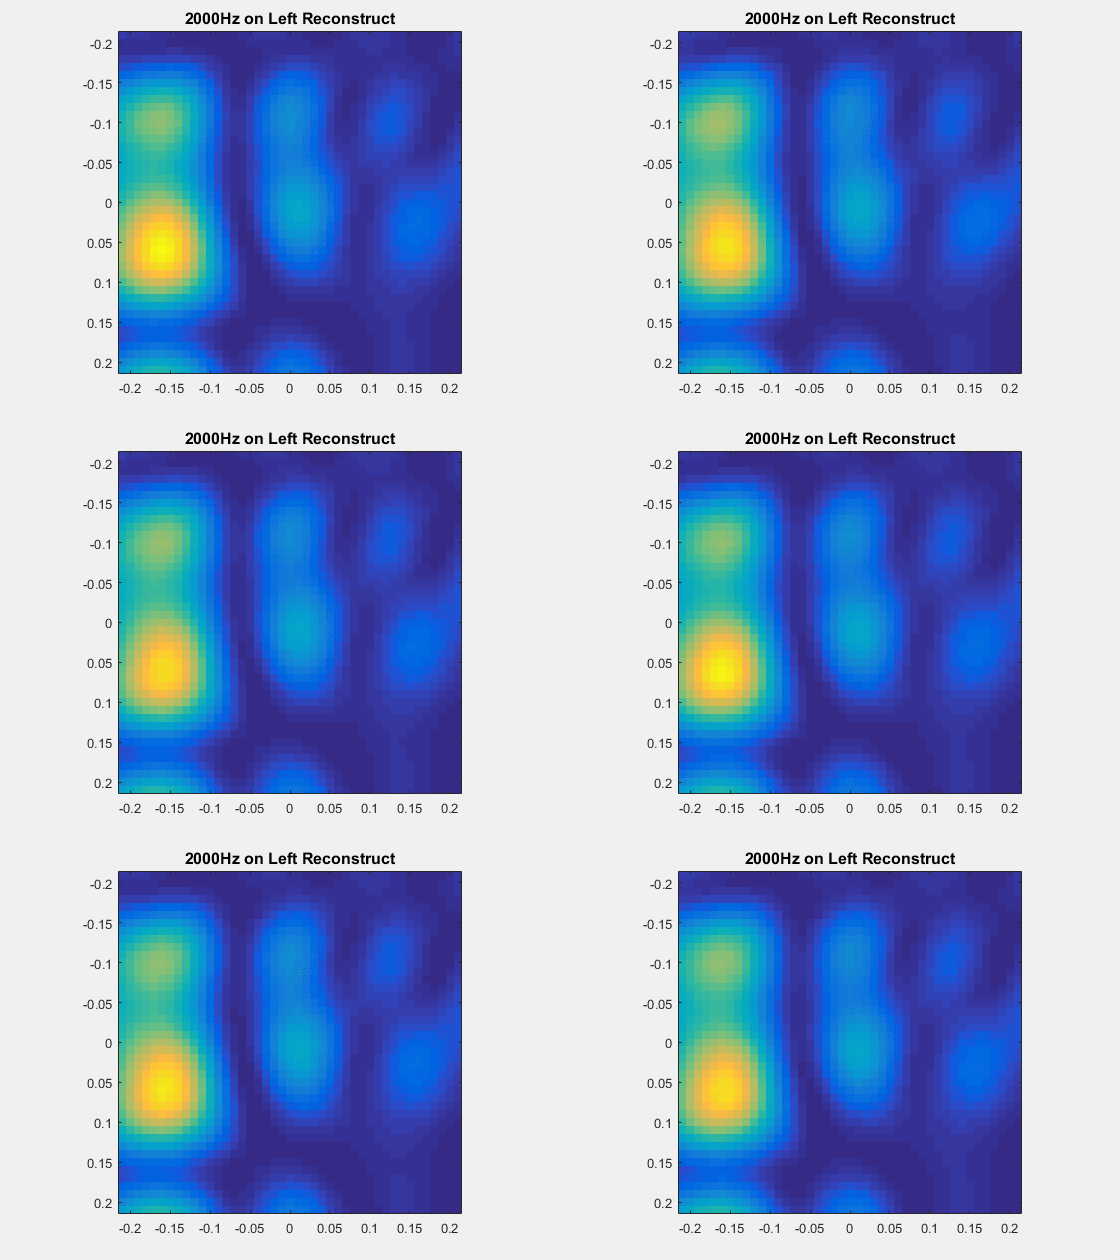 Sound pressure radiated from the left woofer and tweeter is captured by the visualization system.
- Sound field visualization of 2000Hz sine wave on the Right speaker:
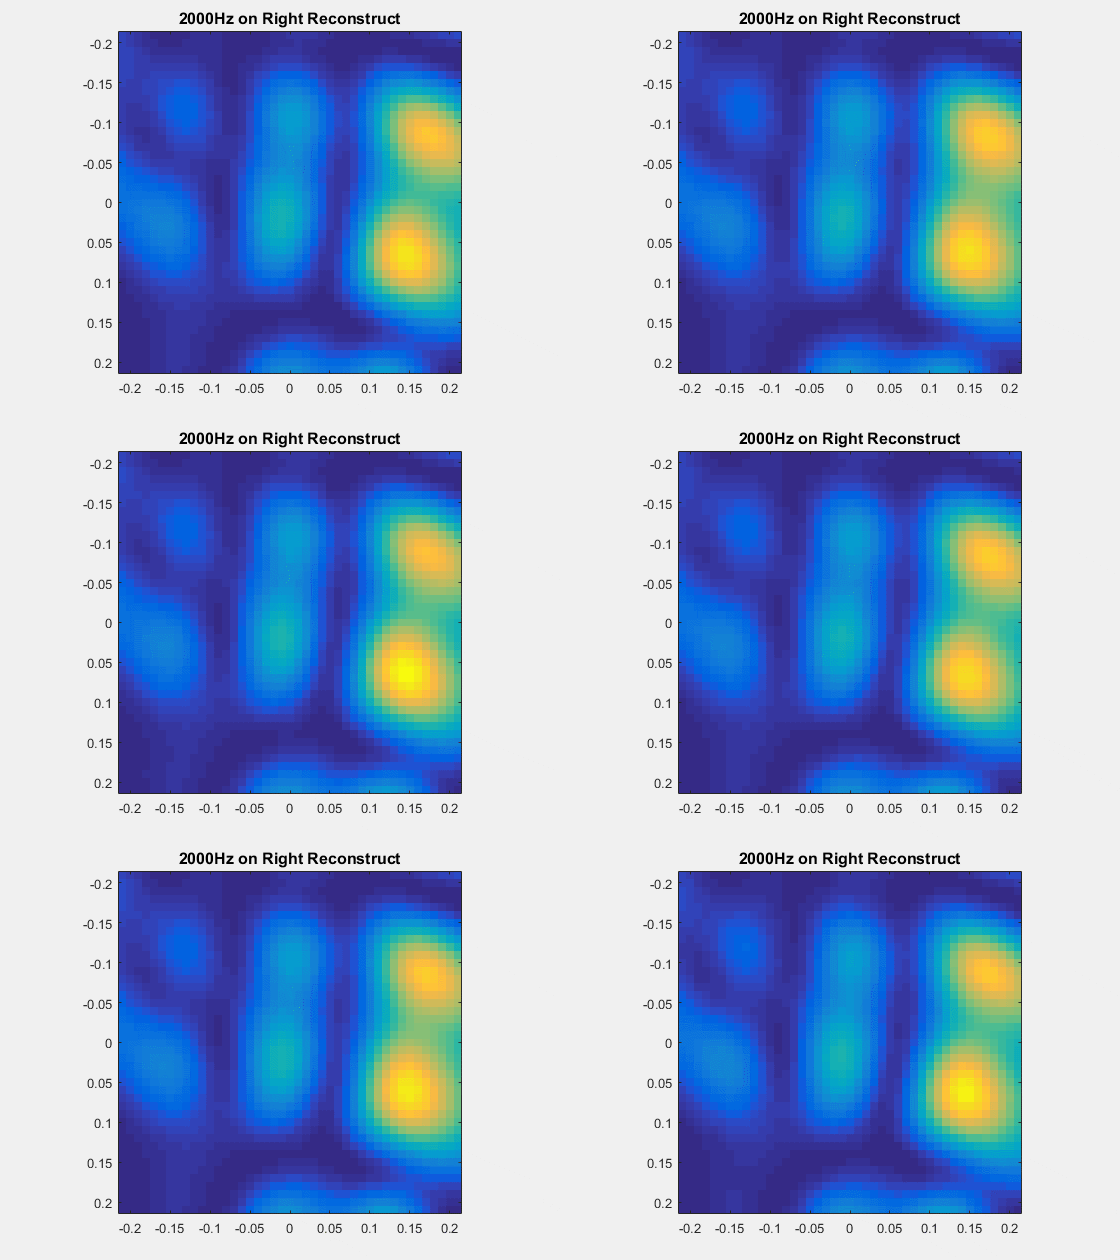 Sound pressure radiated from the right woofer and tweeter is captured by the visualization system.
- Sound field visualization of in-phase 2000Hz sine waves on both left and right speakers:
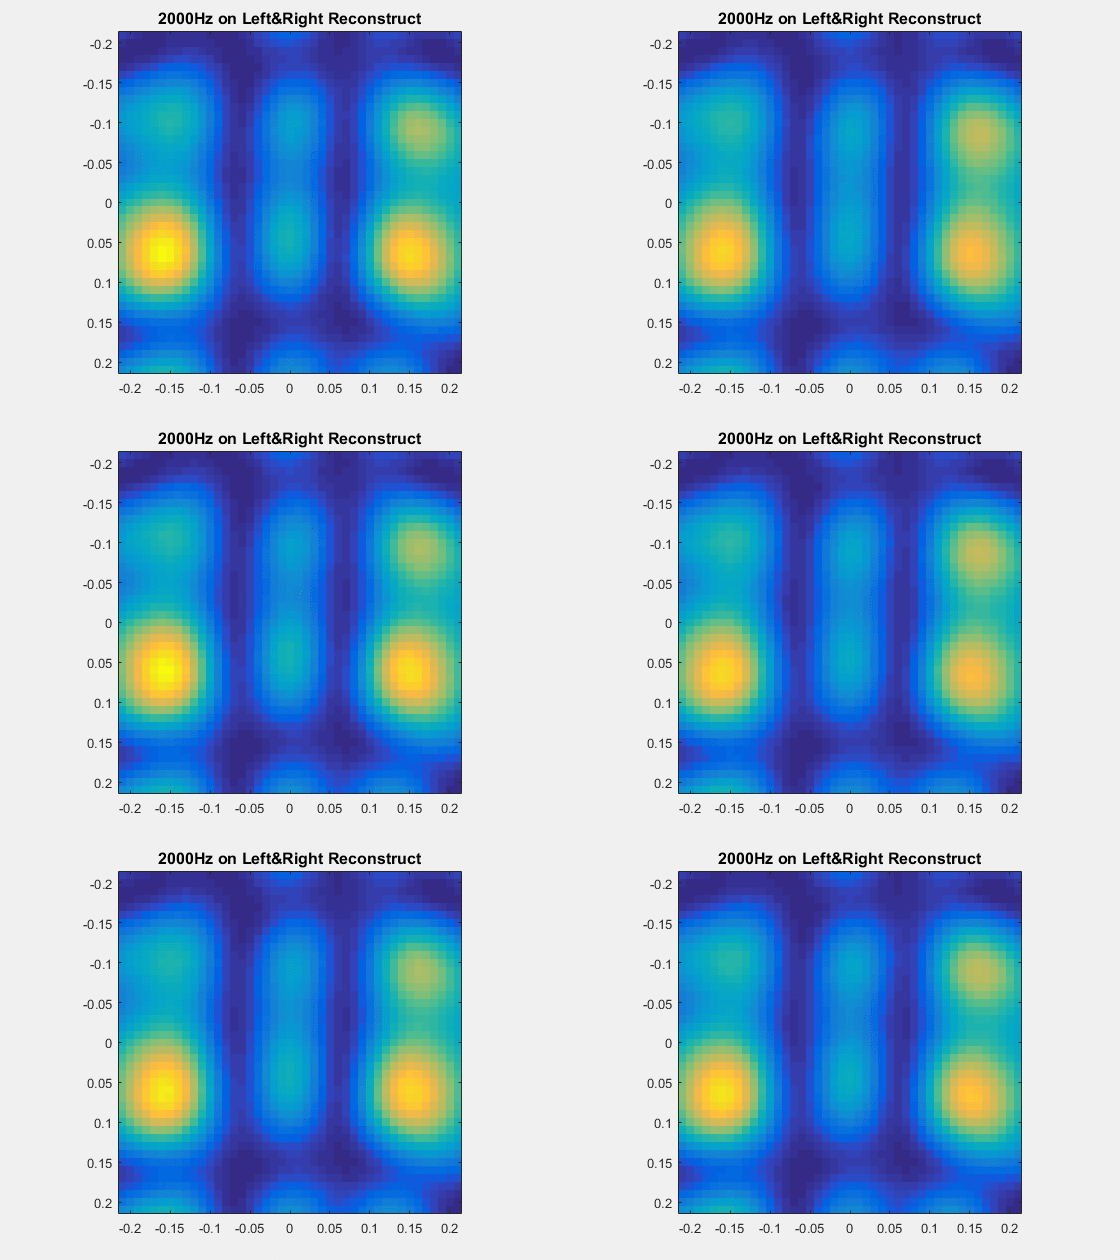 Sound pressure radiated from the left and right woofers and tweeters with the in-phase interfere phenomenon is captured by the visualization system.
- Sound field visualization of inverse 2000Hz sine waves on both left and right speakers:
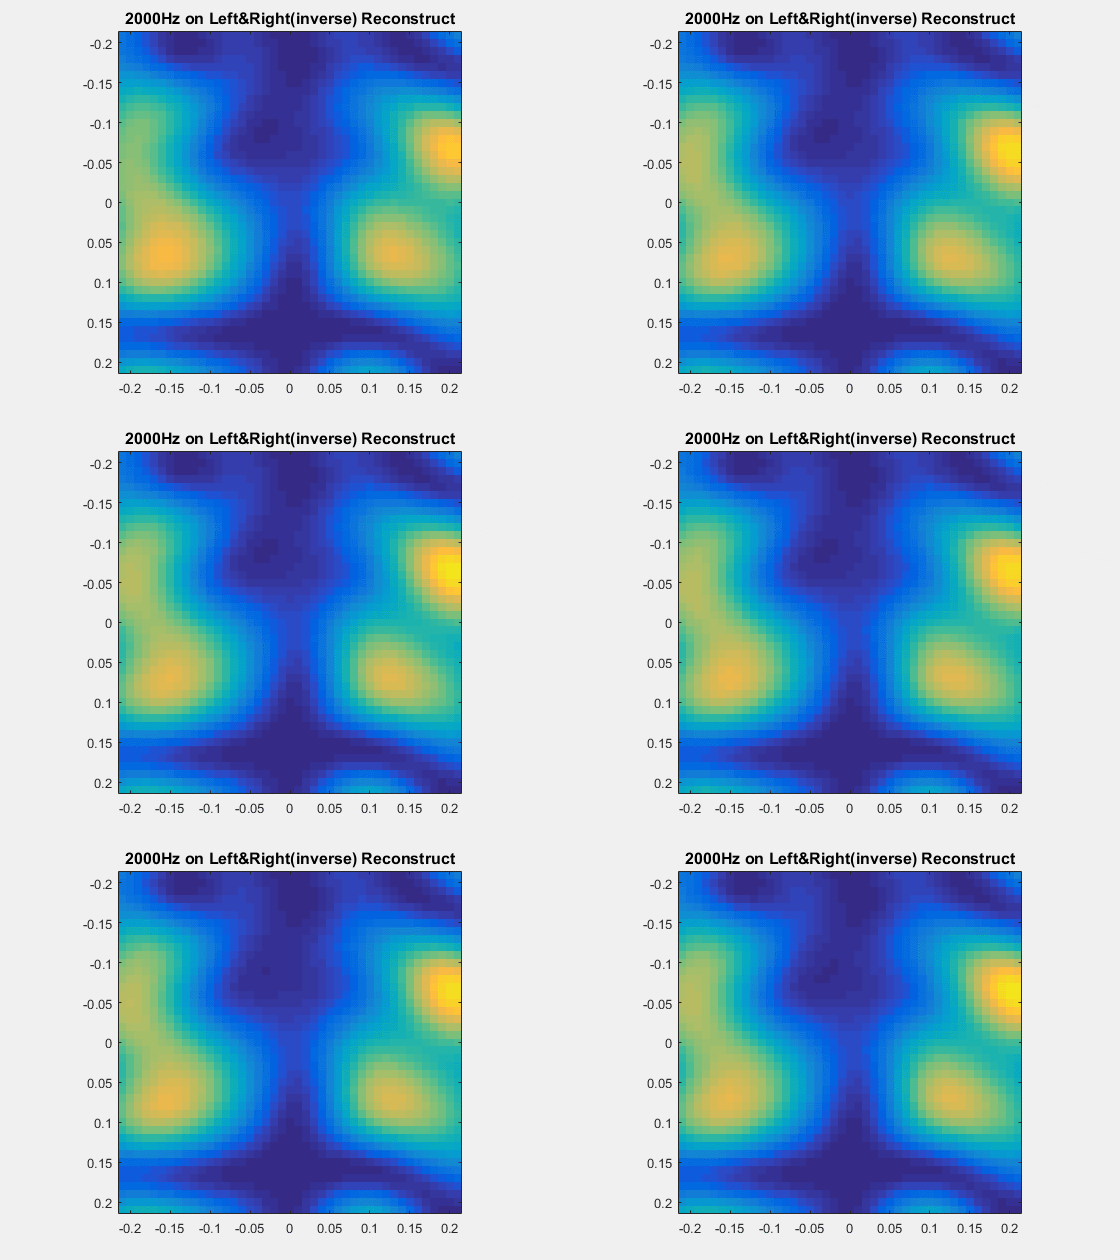 Sound pressure radiated from the left and right woofers and tweeters with the out-of-phase interfere phenomenon is captured by the visualization system.
- Sound field visualization of enveloped independent wide-band noise on both left and right speakers:
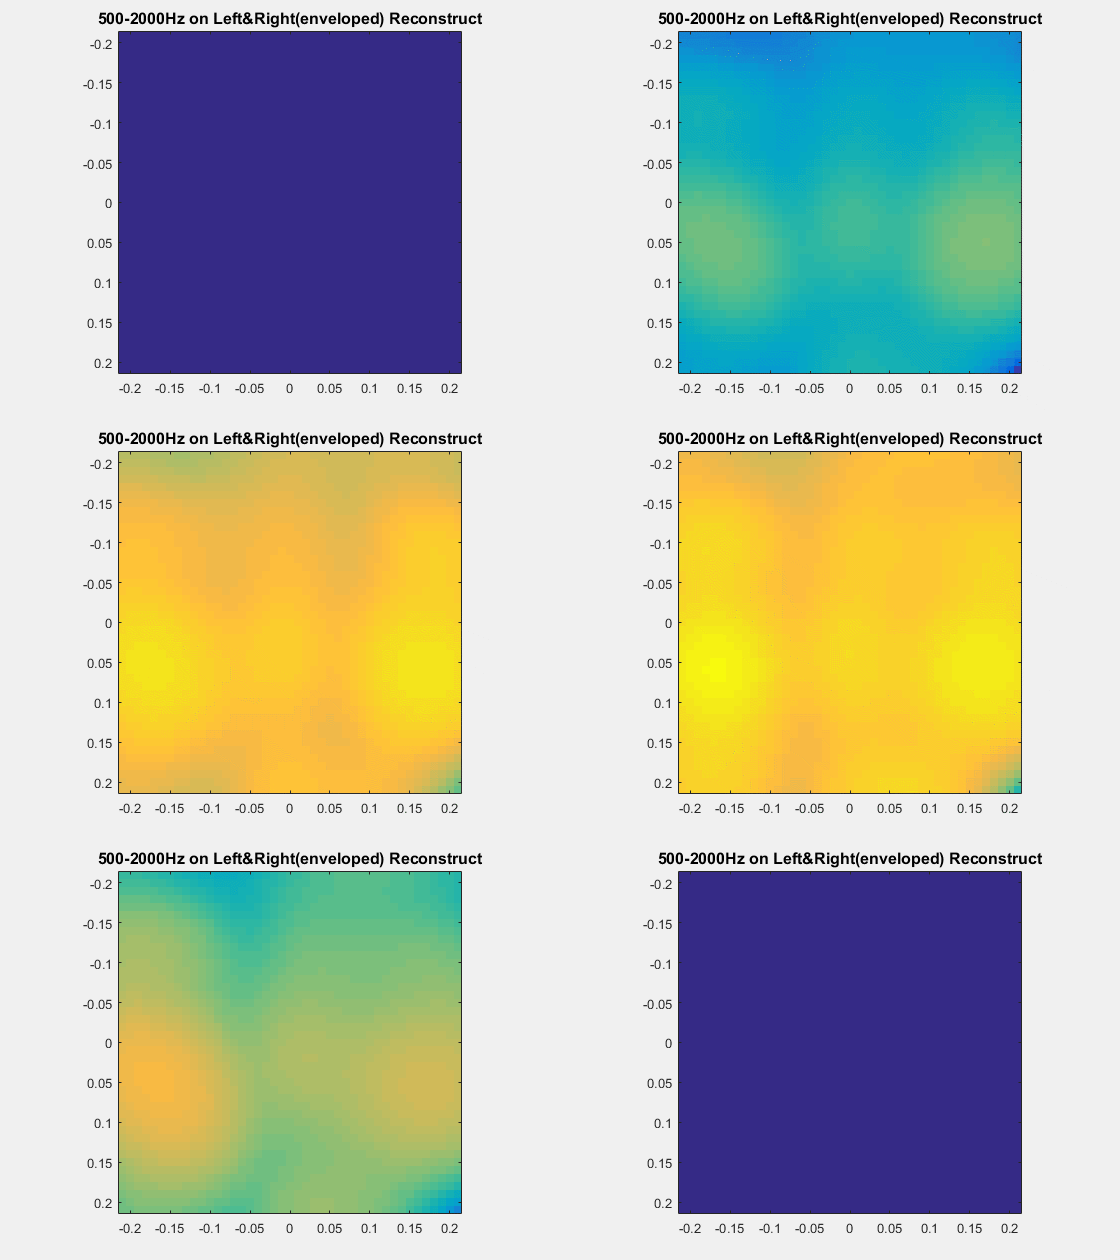 Sound pressure radiated from the left and right woofers and tweeters with independent wide-band noise (60-2000Hz) with a linear amplitude-in-dB envelope captured by the visualization system (in dB).
- Sound field visualization of stereo playback of a song clip of “In My Life” by The Beatles on both left and right speakers:
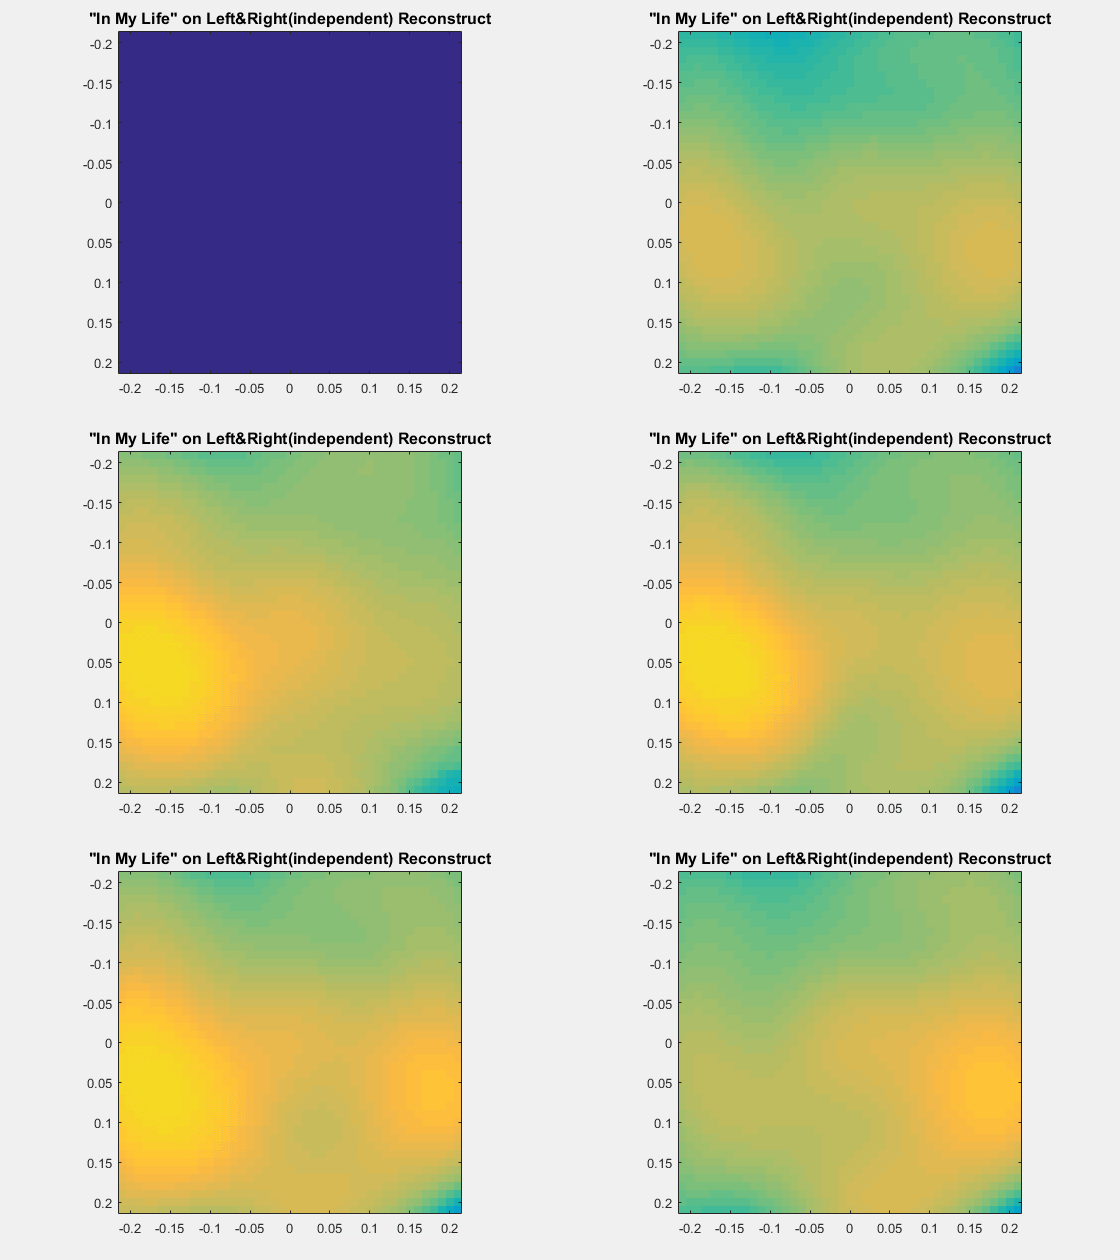 Sound pressure radiated from the left and right woofers and tweeters with the song “In My Life” is captured by the visualization system (in dB). Owing to the recording and mixing technology back in the 60s, the guitars and percussions are panned to the hard left while the vocals and chorus are panned to the hard right, which could be seen from the dynamics of the visualization.
This post is part of the results of the paper DSP-Based Implementation of a Real-time Sound Field Visualization System Using SONAH Algorithm.
Zhe Zhang all rights reserved.